If AWS only provides a bare-metal server, and you will need to pay per request or per month on their node detection service. That will be harsh for them not to provide such service, but it will be very expensive for companies to have to pay for such feature and the instance. Detecting if a Node is dead sounds like a very simple process. However, it is actually a very hard process to do. We often granted third-party cloud services having this simple feature to help us monitor our node’s health.
To tolerate faults, we need to detect them. However, in this article, you will see how hard it is to detect node failure. We will also discuss a high-level architecture design on detecting a node failure detection with phi accrual.
Understanding How Latency happens
The slowness in the network is like traffic congestions in Disneyland. Imagine when you are waiting in line to ride the magic mountain. At the front of the queue, you see that the waiting time is 10 minutes. You may think to yourself, 10 minutes is not a long time. Hence, you wait in line. A few minutes pass by. You started to see that you are almost in the front of the queue - only realized that there is a longer section queue in front of you that you need to wait an additional 30 seconds. Latency work similar way.
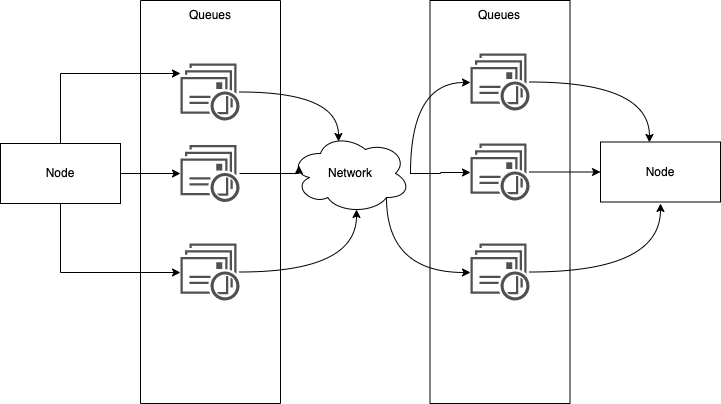
When packets are sent from your machine to the destination machine, they travel through the network switch, and it will queue them up and feed them into the destination network link one by one.
Once it goes to the network link in the destination machine, if all CPU cores are currently busy, the incoming request from the network will be queued up by the operating system until the application is ready to handle it.
TCP performs flow control (backpressure) that limits the number of nodes sent across the network to alleviate the node it contains in the network link. Therefore, it has another layer of the queue for the packets in the network switch layer.
Why is it hard to detect node failures
Imagine if you are running a single program. Even though the program didn’t crash, it is slow and buggy. There is no stack trace in the program that mentions which part of the function or method is not working. This program will be much harder to detect failures than the previous fully failure scenario. This sort of failure is what is called partial failure.
If you are running a single program, if one part of the function is not working, the entire program will usually crash. By then, it showed up a stack trace that you can inspect further to understand why the system crashed.
Partial failures are much harder to detect because they are not either work or it doesn’t. There is numerous possibility why the program is “having a bad day.”
Since distributed systems don’t have a shared state, partial failure happens all the time.
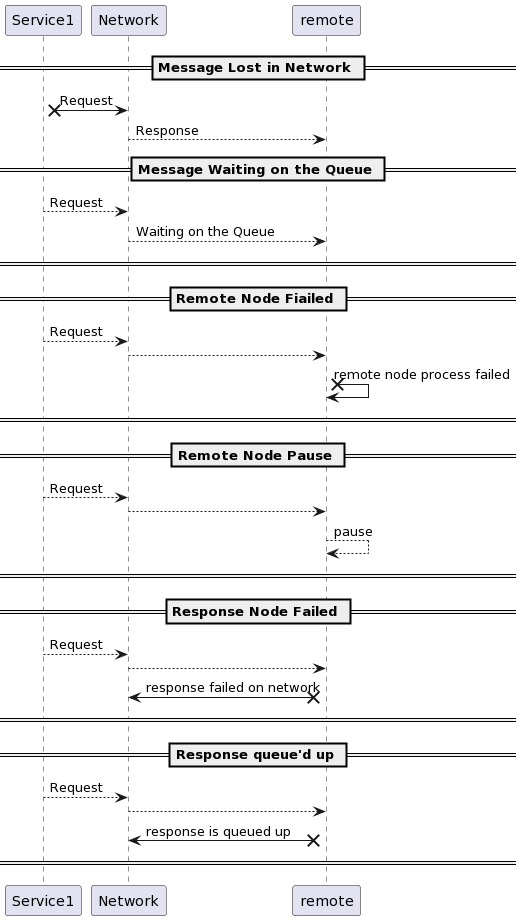
If you didn’t get any response, that doesn’t mean that the node is dead. These are the possibilities of failures:
The message got sent to the network, but it was lost didn’t receive on the other side.
- The message may be waiting in a queue and will be delivered later
- The remote Node may have failed.
- The remote Node may temporarily be stopped responding because of garbage collection.
- The remote Node may have processed the request, but the response is lost in the network
- The remote Node may have a process and responded, but the response has been delayed and will be delivered later.
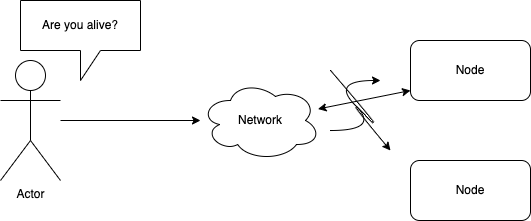
If the network calls didn’t get a response back, it could never know the state of the remote node. However, you should expect no response back most of the time. What shall the load balancer or monitor service do?
Timeout
Usually, load balancers will constantly send health checks to check if the service is in good health. When a remote node is not responding, we can only guess that the packets are lost somewhere in the process.
The next action will be either retry or wait for a certain time until a timeout has elapsed. The retry option may be a little bit dangerous if the operations are not idempotent. Hence, timeout is a better way as doing any more action if you get no response may cause unwanted side-effects, such as double-billing.
If we want to make the timeout approach, how long should the timeout be?
If it is too long, you may leave the client waiting. Thus, having a bad experience on the web.
If you make the timeout too short, you may get a false positive, marking a perfectly healthy node dead. For example, if the node is alive, it has a longer time to process certain actions. Premature declaring the node dead and having other nodes take over may cause the operation to be executed twice.
Furthermore, once the node is declared dead, it needs to delegate all of its tasks to the other nodes, putting more load on the other node, causing cascading failure if the other node already has a lot of loads.
The right timeout period is based on application logic and business use cases.
A service can declare the operation timeout after an x amount of time if the users tolerate that time. For instance, the payment service can set 7 minutes as the timeout period if 7 minutes won’t cause a bad experience to the user. Many teams detect the timeout period experimentally through trial and error. In this scenario, the timeout that we set is usually constant. For instance, within 7 minutes, or 5 minutes…etc.
However, a smarter way to detect timeout is to not treat timeout as a constant value but consist of a distributed variance. If we measure the distribution of network round-trip times over an extended period and over many machines, we can determine the expected variability of delays.
We can gather all the data of the average response time and some variability (jitter) factor. The monitoring system can automatically adjust timeouts according to the observed response time distribution. This method of the failure detection algorithm is done with a Phi Accrual failure detector, which is used by Akka and Cassandra.
Phi Accrual failure detector using sampling fixed window size for each heartbeat to estimate the distribution of a signal. Each time a new it calls the heartbeat to the remote node, it will write the response time to the fixed window. The algorithm will use this fixed window to get the mean, the variance, and the standard deviation of the response time. There is a formula for detecting phi if you are interested here(link).
Thus, in the next section, we will briefly touch on the high-level design of the Node Failure Detection.
Designing a Node Failure Detection
We will use the A node failure detection component consisting of two things: the interpreter and the monitor.
The interpreter’s job is to interpret the suspicion level of the node. The monitor’s job is to receive the heartbeat of each node and delegate the heartbeat time to the interpreter.
The monitor will constantly do a heartbeat to each remote node. Each time it sends a health check to the remote nodes, it will receive a response within a time. It then sends the response time to the interpreter to detect the suspicion level of the node.
There are two ways of placing the interpreter: centralized vs. distributed.
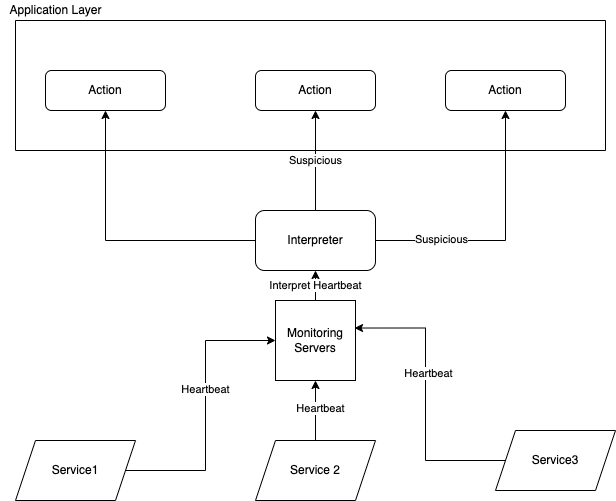
The centralized way is to place the interpreter and the monitor as its own service, and the system interprets each node and sends the signal to other Nodes for further action. The result will be a boolean value, whether suspicion or not.
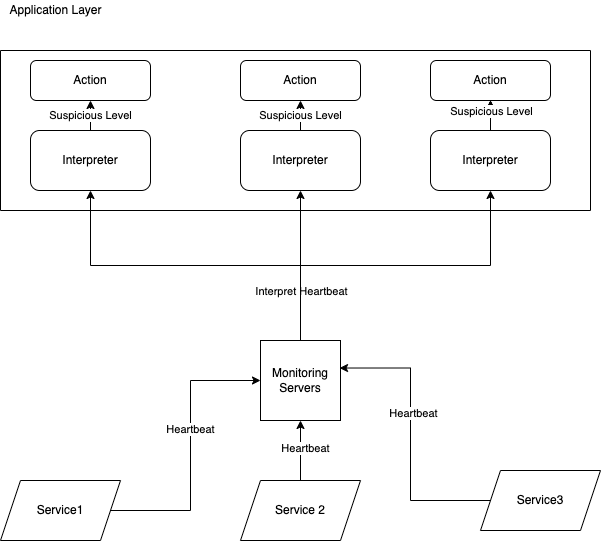
The distributed way is placing the interpreter in each application layer - letting the application have the freedom to configure the level of suspicion and the action it should take on each level of suspicion.
The advantage of the centralized way is that it is easier to manage nodes. However, the distributed approach may fine-tune or optimize each node to behave differently based on different suspicion levels.
We can use the Phi Accrual Failure algorithm for the interpreter that we discussed in the previous section. We set a threshold of what phi - if the phi result is higher than the threshold, we declare the remote node dead. If the phi result is lower than the threshold, the remote node is available.
While the monitor sends the request to the remote node, the interpreter starts timing the response time. If the remote node takes longer than the threshold to respond, the interpreter can stop the request and declare the node as suspicious.
Takeaways
We never think about detecting a node failure when designing an application because it is a build-in feature in each cloud provider. However, detecting a node is not an easy operation. One of the reasons is the no-shared state model in distributed systems. Engineers need to design a reliable system in an unreliable network.
Most of the time, companies do trial and error for detecting node failures. However, instead of treating whether a node is dead with a boolean value, we can approach them in variability - the distributed variance of when a node fails with a Phi Accrual failure detector and set up threshold level for timeouts.
Lastly, the high-level abstraction design for a node detection failure can consist of the monitoring component and the interpreter. The monitoring will constantly send a heartbeat to remote nodes and delegate the response time to the interpreter to analyze the suspicion level. If a node reaches a certain threshold of suspicion level, the interpreter returns a boolean value to the service that calls them to indicate additional action needed.
Do you have any other ideas in which you can detect a node failure in a distributed system? Comment them below!